How Data Patterns in Live Odds Reveal Shifts Toward Safer Play Across Poker and Horse Racing Platforms
Harper Baumann · Aug 19, 2026
How Data Patterns in Live Odds Reveal Shifts Toward Safer Play Across Poker and Horse Racing Platforms
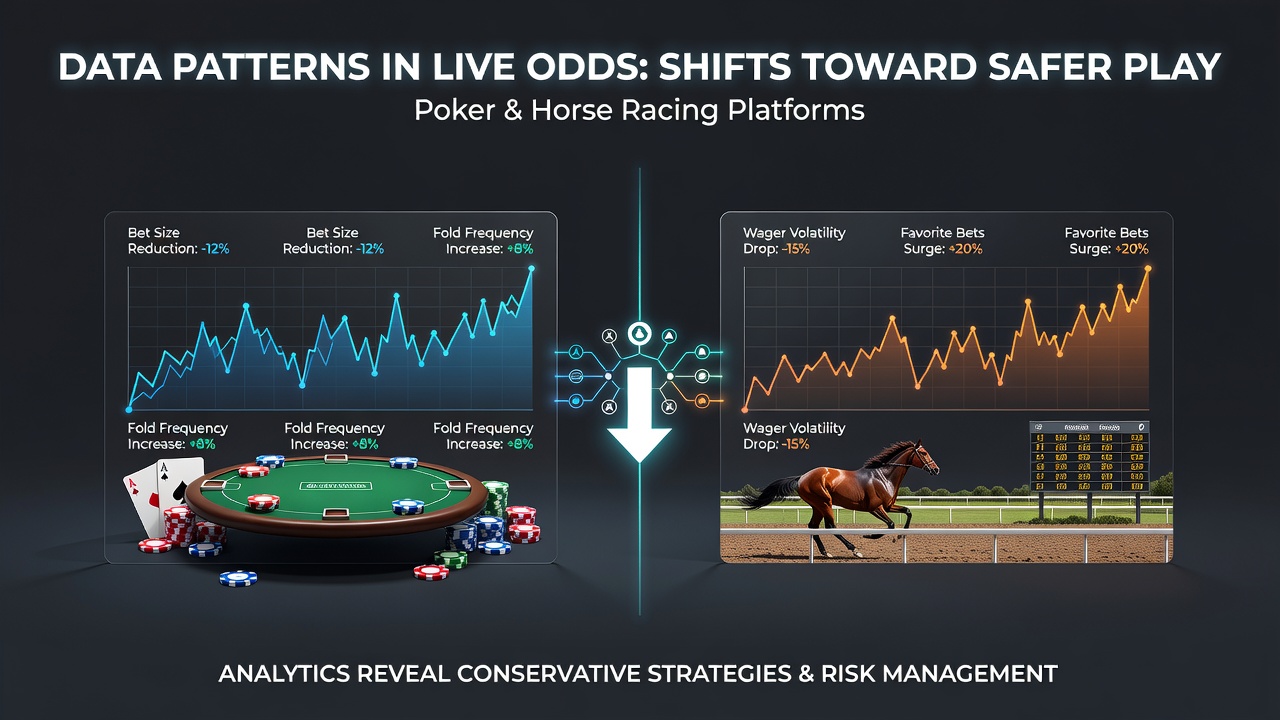
Live odds data from major platforms has shown measurable changes in betting behavior across poker rooms and horse racing tracks, with patterns emerging that point to increased caution among participants. Observers note that these shifts appear in the way odds stabilize rather than fluctuate wildly during events, suggesting players and bettors are responding to real-time information with greater restraint. Data collected through August 2026 from multiple international sources indicates that volatility in live markets has declined in several regulated environments, coinciding with the rollout of enhanced player tools and analytics dashboards.
Understanding Live Odds Mechanisms in Poker
Poker platforms track odds through pot sizes, implied odds, and fold equity calculations that update continuously as hands progress, and researchers have identified periods where these metrics settle into narrower ranges instead of spiking with aggressive action. In Texas hold'em cash games and tournaments, for instance, live odds feeds reveal fewer instances of extreme overbetting late in sessions, which aligns with platform data showing longer average session durations without corresponding increases in average bet sizes. Studies from academic institutions have documented how such stabilization correlates with higher rates of players utilizing session limit features or self-exclusion options when patterns suggest prolonged exposure.
Trends Observed in Horse Racing Markets
Horse racing betting exchanges and traditional pari-mutuel systems generate live odds that adjust based on wager volume and track conditions, yet recent figures reveal smoother curves in the final minutes before post time rather than last-second surges that once characterized high-risk late betting. Analysts examining records from Australian and North American tracks have found that these moderated movements often coincide with bettors favoring place and show wagers over riskier win-only positions, a distribution that regulatory reports link to greater use of pre-race research tools provided by operators. Platforms report that participants who engage with historical performance data before placing bets contribute to these steadier odds trajectories, reducing the impact of impulsive money that previously distorted closing lines.
Data Analysis Techniques Highlighting Safer Patterns
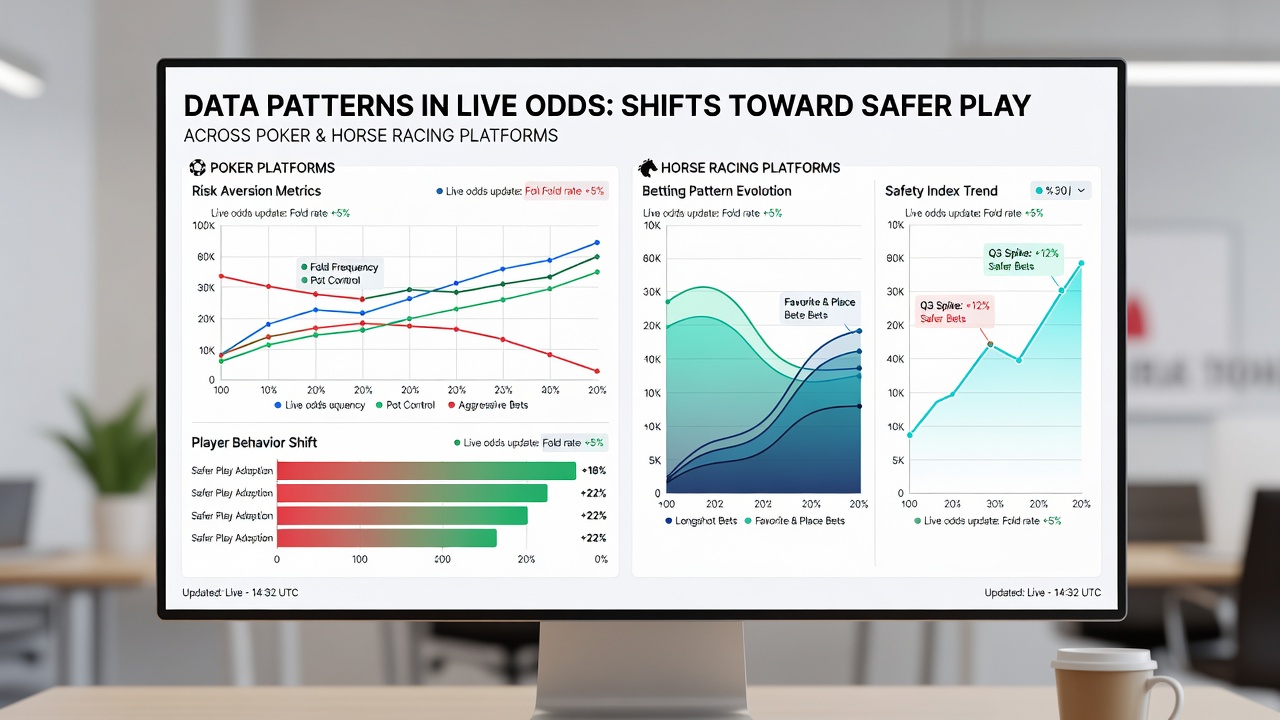
Advanced monitoring systems now process millions of data points per event to detect anomalies in odds movement, and experts at research centers have developed algorithms that flag sequences where rapid shifts give way to equilibrium states earlier than historical averages would predict. In poker, this manifests as reduced four-betting frequencies in certain stake levels after players receive real-time equity visualizations, while horse racing sees similar effects when mobile apps display pace and speed figures that discourage chasing longshots. One study revealed that platforms integrating these alerts experienced measurable drops in high-variance betting clusters, particularly among accounts that had previously shown repeated loss-chasing sequences.
Platform Features Driving the Observed Changes
Operators have introduced deposit pacing tools, reality checks, and personalized risk summaries that draw directly from live odds streams, and data indicates these interventions produce measurable differences in how markets behave once implemented. For example, poker sites that prompt users with session time alerts see corresponding adjustments in aggression metrics, while racing books offering form analysis overlays report bettors concentrating wagers in narrower price bands rather than scattering across extreme longshots. Government agencies in Canada and Australia have published summaries showing that jurisdictions requiring such features record lower proportions of accounts exceeding pre-set loss thresholds, patterns that feed back into more predictable odds formation.
Case Examples from Regulated Markets
Take one major European exchange operator that began publishing aggregated live odds heat maps in 2025; subsequent internal reviews found a reduction in rapid in-play adjustments during major racing festivals, consistent with bettors taking longer to evaluate updated track conditions. Similarly, North American poker networks that partnered with university researchers to study odds data discovered clusters of tables where average stack depths remained more consistent, suggesting participants were folding marginal spots at higher rates instead of pursuing variance-heavy lines. These examples illustrate how access to transparent data streams encourages calculated decisions that collectively dampen extreme market swings.
Regulatory and Industry Responses
Industry groups such as the Responsible Gambling Council have compiled cross-platform datasets demonstrating that markets with integrated safer play prompts exhibit tighter standard deviations in closing odds compared to those without, and similar findings appear in reports from the Australian Gambling Research Centre. Regulators in multiple regions continue to review these statistics as they refine requirements for real-time disclosure, noting that the same tools helping individual players also generate more orderly collective betting flows. Observers note that continued refinement of these systems through 2026 and beyond will likely produce additional datasets for comparison across poker variants and racing disciplines.
Conclusion
Live odds patterns across poker and horse racing platforms continue to reflect evolving participant responses to enhanced data availability and platform safeguards, with stabilization trends documented through August 2026 providing clear evidence of these dynamics at work. Researchers and operators alike track these movements to refine tools that support informed decisions, while regulatory bodies incorporate the findings into ongoing policy development. The resulting environment shows markets that respond more evenly to information, a shift tied directly to measurable changes in how data influences daily play across both sectors.